DrChrono has made significant improvements to the Aging AR Analysis Report. It will give you better clarity into the monies owed to your practice by insurance payers and patients.
Overview | Sorting by group | Sorting columns | Onscreen Report | Exporting | Reset
Overview

- To access the report, navigate to Billing > Aging AR Analysis.
- The tabs to switch between a summary and a detailed view are on the top left of the screen.

- Summary - This tab will show you a high-level view of your accounts receivable from insurance payers and patients in the standard 30-day increments. It is also where you can customize the report to meet your business needs.
- Details - This tab will show all your accounts receivable information that matches your set parameters.
Examples of controls available include the following. Each option may not be available if it does not apply to the tab you view.
- Date Type - Allows you to select Date of Service, First Billed Date, Last Balance Transferred, or Last Billed Date
- Date - Start and Stop date for your report
- Bucket Type - Allows you to select 30 days, Month, or Quarter
- AR Type - Allows you to select All, Insurance, or Patient
- Has Future Follow-up - Allows you to select appointments with or without a future follow-up date
- Has Credit - Allows you to select appointments that have a credit
- Submission Status - Allows you to select claims that have either been submitted or not submitted
- Measure - Allows you to view the report by balance or expected balance
- Payer ID - Allows you to select a specific payer ID or all of them
- Insurance Name - Allows you to select a specific payer by name
- Office - Allows you to view a specific office, a combination of offices, or all of them
- Patient - Allows you to view a specific patient
Once you have set your parameters, the report will populate automatically. The Data Freshness date and time will indicate how current the information is.
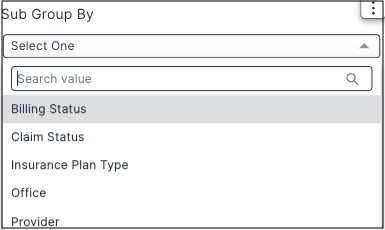
Sorting by Group and Sub-group
From the same area, you can select how to group and sub-group the information listed in your report.

Sorting Columns
You can press on any report header to sort in ascending or descending order or drill into additional details.

Onscreen Report
Once you select your parameters, you will see your report onscreen on the summary tab:

Here is just the summary report that appears on the bottom left of the screen that's a little easier to read.

Exporting to CSV or Excel
You can also export the report to CSV or Excel by pressing the 3 vertical dots on the right of the screen The report will be generated and available on your device.

Resetting and/or Refreshing values
If you would like to change a control and run a different report, you can reset and/or refresh the values on each control by pressing on the three vertical dots just to the right of the control name. If you hover in the area, the three vertical dots will appear.
